Dashboards Nobody Opens: How to Build Reporting People Check Every Morning
Why dashboards get ignored and how to build reporting that drives decisions: the 5-second test, KPI starter sheets and daily push reporting.

7 min read
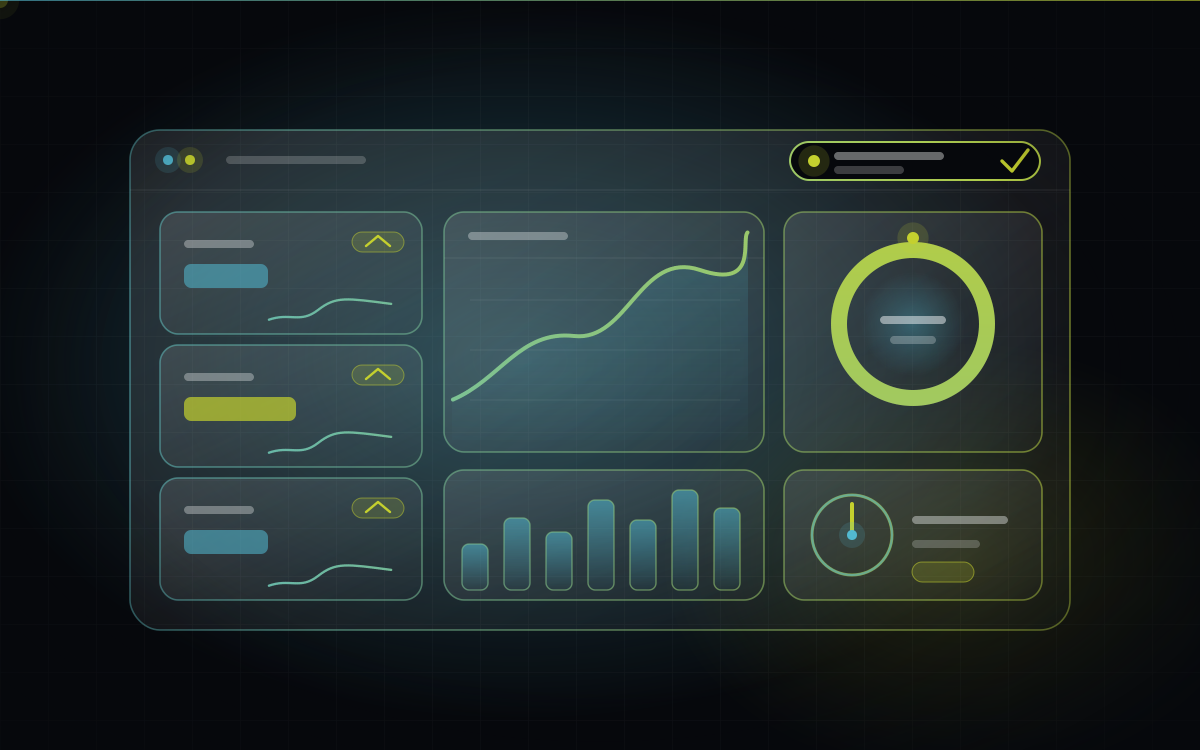
Table of contents
Someone spends weeks building a beautiful business dashboard. Fourteen charts. Smooth colours. Filters for everything. Launch day brings applause and a few screenshots in the group chat.
Two months later, nobody opens it. The owner is back to calling the manager and asking, “So, how are we doing this week?” The dashboard sits there, glowing quietly in a browser tab nobody clicks.
This happens far more often than anyone admits, and almost never because the dashboard was ugly. It happens because a dashboard is a decision tool, and it was built as a data display. This post shows you how to build the first kind.
The short version
Dashboards die from too many numbers, numbers nobody trusts, and no link to any decision.
A good dashboard passes the 5-second test: you know whether today is fine or needs action.
Pick 5 to 7 numbers using one question: “What would I do differently if this changed?”
Push the key numbers to people each morning. Don’t wait for them to come and look.
Why dashboards die
When reporting gets ignored, it’s usually one of these:
Too many metrics. When everything is on the screen, nothing stands out.
Nobody trusts the numbers. If two reports disagree even once, people go back to gut feeling and stop looking.
No connection to a decision. A number that doesn’t change anyone’s behaviour is trivia.
The data is late. If it’s three days old, it’s history, not management.
It was built for the wrong person. Designed by technical people, for an imagined user, without asking the people who need to act on it.
It lives somewhere inconvenient. If checking it takes a login, a laptop and five clicks, it won’t be checked.
The 5-second test
Here’s a ruthless way to judge any dashboard. Open it and start a timer.
Within 5 seconds, can you tell whether today is fine, or whether something needs your attention?
If you need to scroll, squint, filter or interpret, the dashboard has failed. The best dashboards behave like a car’s dashboard: speed, fuel, one warning light. You don’t study it, you glance at it.
How to choose your 5 to 7 numbers
For every number you’re tempted to include, ask one question:
“If this number changed, what would I do differently?”
If there’s a real answer (“I’d call the customers with overdue payments”), it earns a place. If the honest answer is “nothing,” leave it out.
A useful way to cover the ground is to think in three layers:
Layer | The question it answers | Example numbers |
Health | Are we okay right now? | Sales vs target, orders in hand |
Flow | Where is work getting stuck? | Pending orders by age, order-to-delivery time |
Money | Is cash coming in on time? | Overdue payments, receivables ageing |
Two or three numbers per layer is plenty.
The foundation: one source of truth
Here’s the uncomfortable truth: a dashboard built on scattered data is just a scattered dashboard with nicer charts.
If orders live in one tool, payments in another and stock in a sheet, a dashboard has to stitch them together, and any mismatch becomes a number people argue about. Before building the display, make sure the data is captured once, in the right place, as the work happens. (If this sounds familiar, it’s the same root problem as the patchwork of tools many businesses live with.)
Trust is the real currency of a dashboard. Once people believe the numbers, they use them. Once they don’t, nothing else matters.
KPI starter sheets by business type
These are starting points, not rules. Your own business will shape the final list.
Textile and apparel
Orders in hand versus production capacity
Order-to-dispatch time
Pending orders by age (how long they’ve been waiting)
Rejection or returns percentage
Stock by lot, design or shade (what’s sitting idle)
Receivables ageing (who owes you, and for how long)
Retail and distribution
Daily sales versus target
Fast-moving and slow-moving stock
Stock-outs on key items
Margin by category or product
Receivables and payables ageing
Repeat customer rate
Services and agencies
Team utilisation (billable time versus available time)
Sales pipeline value and conversion rate
Projects delivered on time
Overdue invoices
Client retention
Revenue per client
Design rules that make people actually look
Put the most important number top left. That’s where eyes land first.
Use colour for meaning, not decoration. Reserve red, amber and green for “needs action,” “watch,” and “fine.”
Show the trend, not just the number. “₹4.2 lakh” means little. “₹4.2 lakh, up 12% from last week” means something.
Always show against a target. A number without a benchmark invites shrugs.
Use plain language. Label things the way your team talks, not the way the database names them.
Make it work on a phone. Many owners and managers check in on the move.
Let people drill down in one tap. When something looks off, the next question is always “why?”
Push, don’t pull
The single biggest upgrade most dashboards can make: stop waiting for people to visit.
Send a short daily summary at a set time, say 9 a.m., on a channel people already read, such as WhatsApp or email: five numbers, a clear indicator of anything unusual, and a link to the full view. Add exception alerts for the things that truly can’t wait, like a big order stuck for days or a major payment overdue.
People forget to open a dashboard. They don’t forget a message that lands on their phone.
How to build it, in the right order
Agree on the decisions first. What decisions does this need to support, and who makes them?
Fix the data capture. Make sure the information is recorded once, properly, as work happens.
Build version one with five numbers. Resist the urge to add more.
Use it for 30 days. Review it in your regular meetings. Notice what people look at and what they ignore.
Add only what people ask for. Let real use shape version two, instead of guesses.
Frequently asked questions
Both can work. Ready-made business intelligence tools are excellent when your data is already organised in one place and you mainly need charts and reports. Custom dashboards make sense when you need a live view across several systems, or want reporting built directly into your daily workflow. The right answer depends on your data and how people work.
The bottom line
A dashboard isn’t measured by how much it shows. It’s measured by how many good decisions it causes.
Start with the decisions, trust the data, keep the numbers few, and send them to people before they have to ask. Do that, and the dashboard stops being something you built and becomes something your business runs on.
Want reporting your team actually uses? At BeMotion, we start with the decisions you need to make, then build the data foundation and the dashboard to match, so the numbers you see every morning are ones you can trust.
Written by
BeMotion Nova Labs
Software, intelligent systems and technology solutions built for ambitious businesses.
View all articles by BeMotion Nova LabsReady to get started?
Let's talk about what you want to build.
Tell us where you are and where you want to get to. We will reply with honest next steps.
Discuss your project